
SpeedFit™ Design Simulator
Simulate and evaluate the performance of SiC-based power circuits and determine the right SiC device in seconds.
Start a SimulationTypical current output (inverter application)

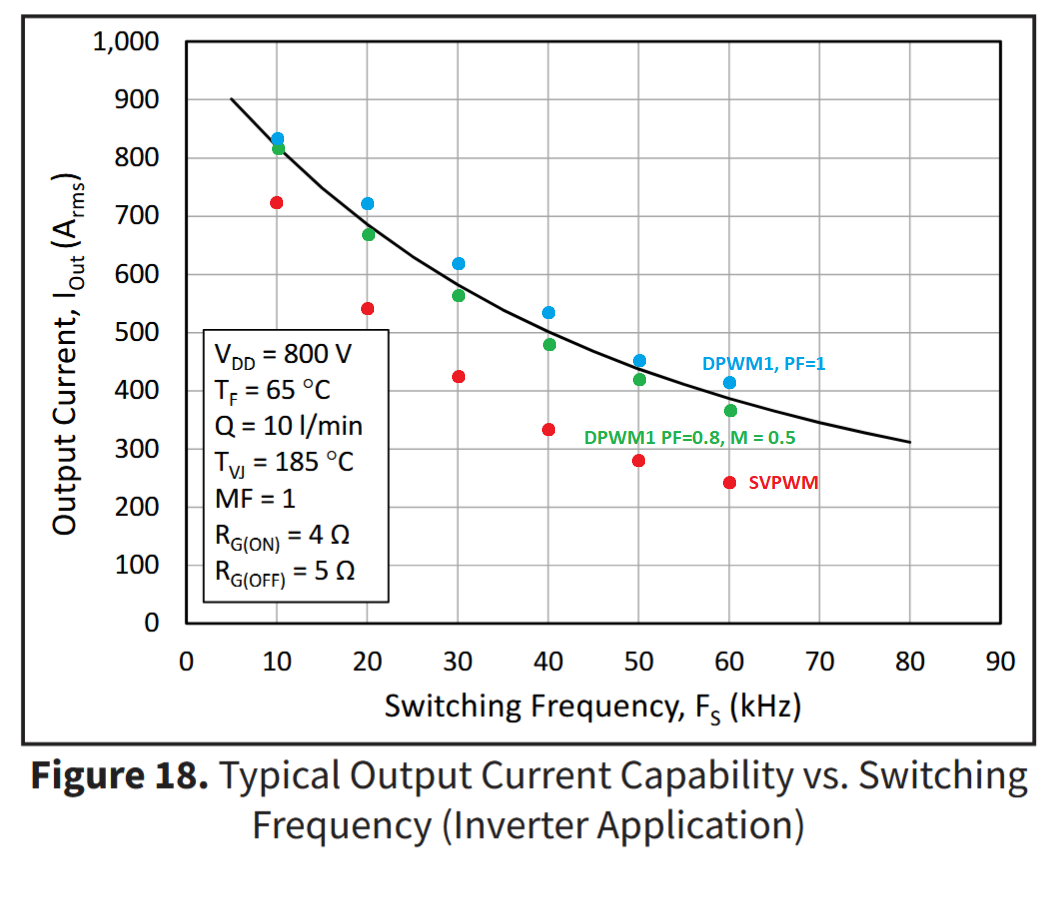
I'm looking at the datasheet of QECB1R6M12YM4 and the graph "Typical Output Current Capability vs. Switching Frequency (Inverter Application)". Does anyone know what modulation strategy was used to compute the graph? I've tried running our script with different power factors and modulation indexes with three different modulation strategies and I get the following graph. None of the options matches perfectly, but it looks like DPWM1 is the closest.
Comments
-
Thank you for your post, it has been approved and we will respond as soon as possible.
0 -
Hello, thank you for reaching out to our forum!
We truly appreciate the effort you put into replicating the operation of the ECB1R6M12YM4 under different power factors and modulation indexes. The plot you shared is very detailed and insightful.
To clarify, the curve shown in the datasheet represents a generalized estimate of output current capability. It is not tied to a specific PWM strategy but rather calculated from a range of operating points, considering the expected conduction and switching losses of the module. This approach provides a practical reference for inverter applications without assuming a particular modulation scheme.
Your analysis highlights an important point: different PWM strategies and power factors can significantly influence thermal performance and current capability. While the datasheet curve serves as a baseline, real-world results may vary depending on modulation technique, switching frequency, and cooling conditions.
Please let us know if this addresses your question.Best regards,
Sergio J.
0